
Image to text with formatting: a 10-block OCR test
We tested a report image with headings, bullets, a paragraph, chart and footer. Nine text blocks kept their structure; the chart stayed a figure.
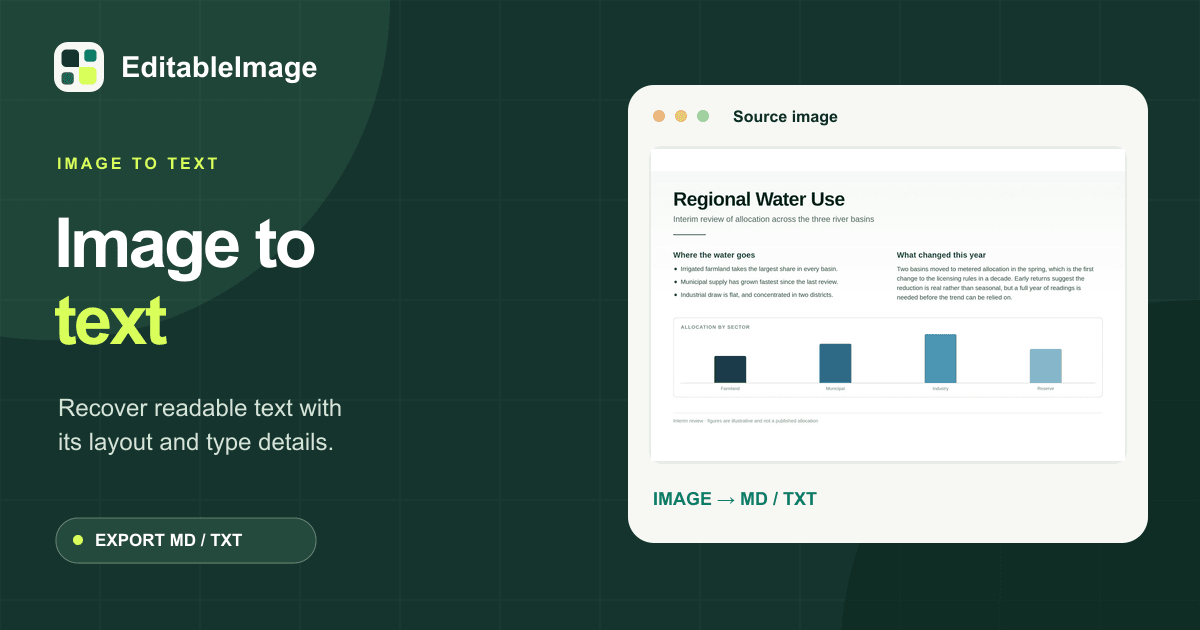
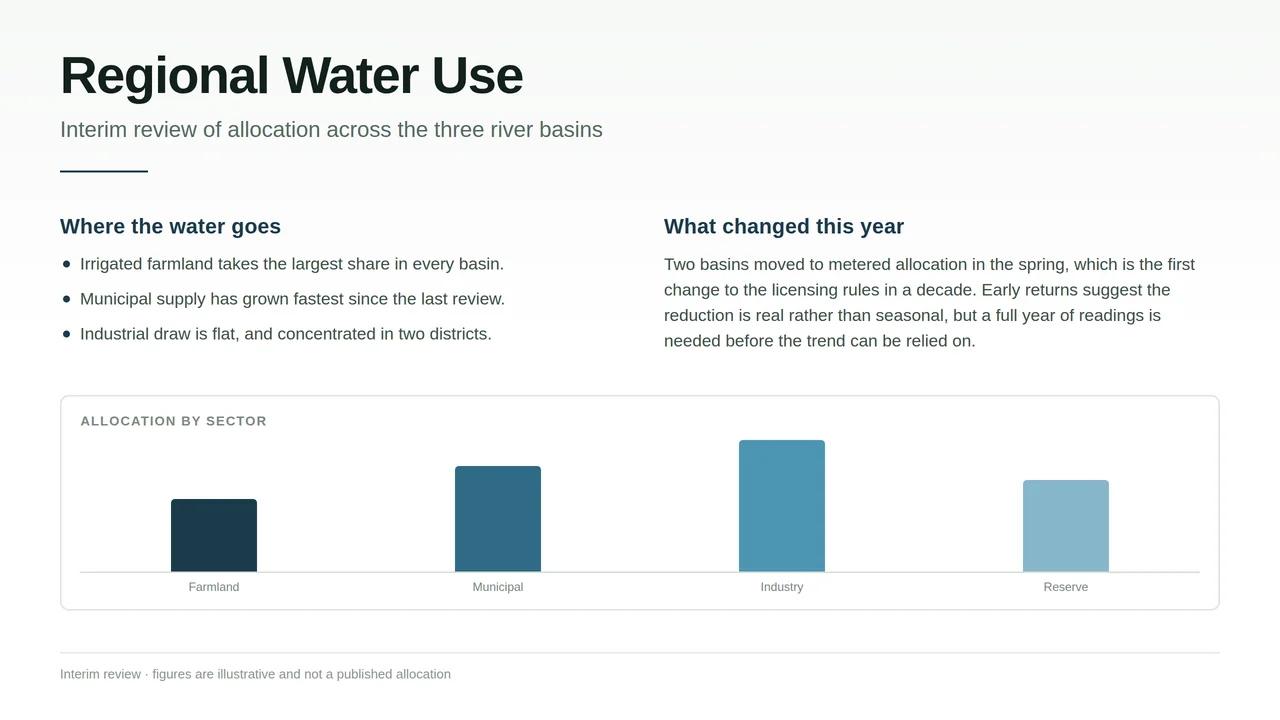
We ran a 1280×720 report image through image-to-text extraction and got ten structured blocks: nine text blocks and one chart block. The title and section headings remained headings, the three bullets remained list items, the paragraph stayed together, and the footer stayed separate. The chart was identified but its internal labels were not mixed into the text.
That last result is a limitation and a useful safeguard. Plain OCR often returns every visible word in one stream, including chart axes in the middle of a paragraph. Structured extraction should preserve what a block means as well as what its letters say.
What image did we use for the OCR test?
The source contains a title, subtitle, two columns, three bullet points, one long paragraph, a bar chart and a footer. It is clean enough to read, but complex enough to test document order and formatting.
What text and structure came back?
The image-to-text converter returned one block for each meaningful region:
- Title — “Regional Water Use”
- Subtitle — “Interim review of allocation across the three river basins”
- Left section heading — “Where the water goes”
- First bullet
- Second bullet
- Third bullet
- Right section heading — “What changed this year”
- Right-column paragraph
- Chart block
- Footer note
The Markdown export kept the title and section labels as headings and emitted the three items
with - list markers. The chart became:
_[Chart or table — not transcribed]_
Its title, category labels and axis values were not inserted into the prose. If the goal is to edit a chart rather than extract the surrounding document, use a slide or diagram workflow and check the visual result separately.
What formatting did it measure from the pixels?
This was not just character recognition. The run measured size, weight and ink colour for each text block:
| Block | Measured type | Measured colour |
|---|---|---|
| Main title | 52 px · 700 | #0e1b16 |
| Subtitle | 22 px · 400 | #58645f |
| Section headings | 21 px · 700 | approximately #182f3d |
| Bullets and paragraph | 17 px · 400 | approximately #4b5551 |
| Footer | 13 px · 700 | #9fa3a0 |
These are measurements from the rendered pixels, so they will not always equal the CSS or design file values that originally produced the image. Antialiasing, resizing and compression all change the sampled colour and apparent size. The measurements are useful for reconstruction and comparison, not proof of the original font specification.
How is formatted image-to-text different from plain OCR?
Plain OCR answers “which characters are visible?” Formatted extraction also has to answer:
- Which lines form one paragraph?
- Which blocks are headings?
- Which lines are list items?
- What is the reading order across columns?
- Which region is a chart rather than body text?
- What size, weight and colour does each block appear to use?
That extra structure is what makes the result useful as Markdown or as the start of an editable document. It is also where mistakes can happen, especially on dense magazines, multi-column papers and pages where captions sit close to figures.
What should you check before using extracted text?
Proofread numbers, short labels and similar characters such as 0/O, 1/l and 5/S. Then check
the block order: a two-column page can be read across the page when it should be read down one
column first. Finally, compare every figure boundary with the source so chart labels have not been
silently inserted into surrounding prose.
For this test, the nine textual regions and their roles were recovered. The chart itself was kept as a figure marker, so its four category labels would still need another workflow if they were required as editable text.
The tested workflow
- Open Image to Text and upload or paste the original-resolution image.
- Select each detected block and compare its wording, type measurement and position with the source.
- Check heading levels, bullets and reading order before copying.
- Export Markdown when structure matters, or TXT when only the words are needed.
The useful result is not a larger pile of recognized words. It is text that still explains which parts were headings, which were lists and which part of the page was never text at all.
Questions
- Does image-to-text keep headings and bullet lists?
- In this test it did. The title and two section headings remained headings, and the three bullet lines exported as Markdown list items instead of one plain paragraph.
- Did it extract the words inside the chart?
- No. The chart returned as a chart block marked “Chart or table — not transcribed.” That avoids mixing chart labels into the document text, but use a chart-specific workflow if those labels are needed.
- What formatting details were measured?
- Each text block carries its position, font size, weight and colour. The title measured 52 px at weight 700; body copy measured 17 px at weight 400 in this example.