
Screenshot to editable PowerPoint: a real slide test
We converted an energy-report screenshot to PowerPoint and checked 12 recovered objects. See what stayed editable and what still needs review.
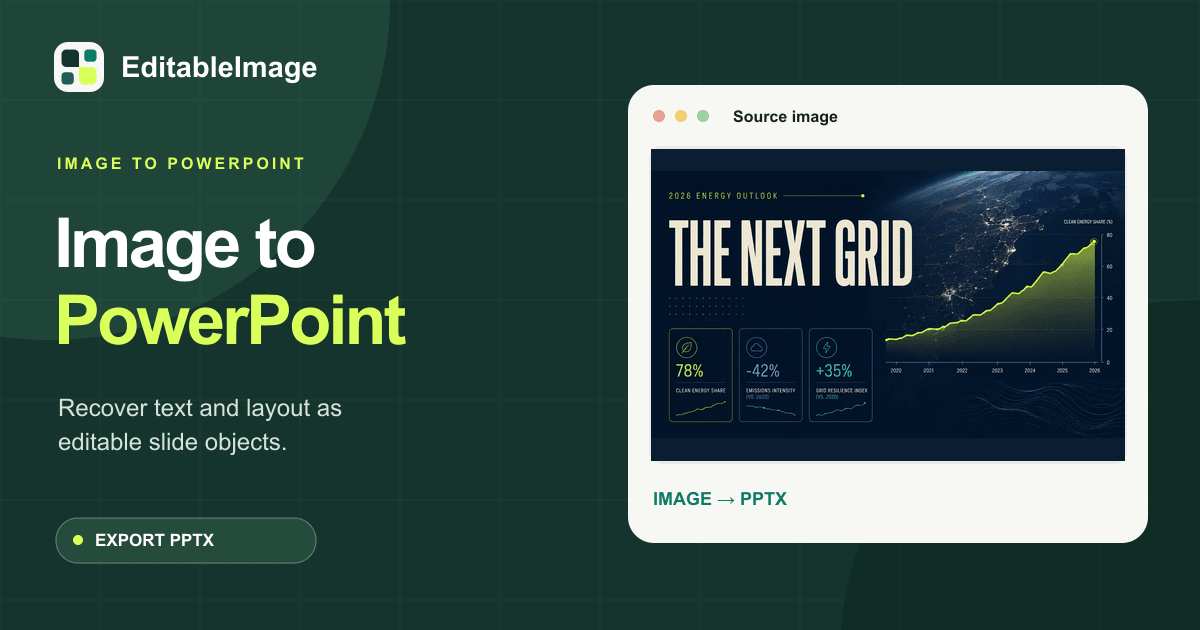
A slide screenshot can be converted into an editable PowerPoint when its text and layout are rebuilt as separate objects instead of placing the whole screenshot on one slide. In our 1280×720 test, the reconstruction returned 12 editable slide objects. The title, KPI cards and chart region could be selected separately; the Earth photograph and textured background remained visual material rather than becoming invented vector artwork.
That distinction matters. A file can end in .pptx and still contain nothing but one flat
picture. The test below checks what can actually be selected and changed after conversion.
What image did we convert to PowerPoint?
The input was a finished presentation slide called The Next Grid. It combines a large condensed title, three KPI cards, small labels, a line chart, an Earth photograph and a dark textured background.

This is a useful test because it mixes the parts a converter should rebuild with the parts it should leave alone. The title and metrics should be editable. The detailed photograph should not be replaced with a rough collection of shapes just to increase an object count.
What did the screenshot-to-PowerPoint test return?
The current example in Image to PowerPoint returned twelve objects. We checked the result by selecting the title, the chart region and the KPI card group separately in the recovered slide.
| Part of the slide | What came back | What that lets you do |
|---|---|---|
| Main title | Editable text object | Retype the headline and change its size or colour |
| Small headings and KPI values | Separate text boxes | Correct figures and labels without repainting the slide |
| KPI cards | Separate layout objects | Move or restyle a card independently |
| Chart region | Separate visual region | Reposition or replace it without moving the title |
| Photograph and textured backdrop | Rebuilt background | Preserve visual detail without pretending every pixel is a PowerPoint shape |
The chart being separate does not mean its original spreadsheet data was recovered. A line chart flattened into pixels contains no hidden workbook or data series. Treat the recovered chart as a visual region unless the exported file clearly exposes native chart data.
How is this different from putting the screenshot on a slide?
Inserting the source image into PowerPoint gives you one selectable rectangle. Changing “THE NEXT GRID” means covering the old words, finding a similar font and rebuilding the spacing by hand. Moving one KPI card means cropping or repainting part of the screenshot.
Image to editable PowerPoint first reads the layout, then creates text boxes and simple slide elements at the measured positions. The detailed visual material remains in the reconstructed background. That gives you useful editability without turning a photograph into hundreds of low-quality shapes.
What still needs checking in the exported PPTX?
We would check these five things before presenting or sharing the deck:
- Read every number and label. A single mistaken digit matters more than a small visual shift.
- Compare line breaks. A substitute typeface can make a heading wrap sooner than the original.
- Move one object from each group. This confirms that cards and text are separate rather than one flattened image.
- Inspect charts as charts, not decoration. Replace the visual with a native chart if the data needs updating.
- View the slide at 100%. Thin lines, text baselines and the edges of the rebuilt background are easier to judge there.
The source image stays available beside the result, so these checks do not depend on memory.
When is screenshot-to-PowerPoint reconstruction worth using?
It is a good fit when a deck survives only as screenshots, exported slide images or pages inside a PDF, and the next edit affects titles, labels, cards or layout. It is less useful when you only need the picture displayed unchanged, or when the most important requirement is recovering the original chart data and exact licensed font.
The tested workflow
- Open Image to PowerPoint and upload one slide at full resolution.
- Compare the recovered objects with the original image.
- Retype one text box and move one layout element to confirm they are independent.
- Export the PPTX and open it in PowerPoint for a final check at 100% zoom.
The useful result is not “a PowerPoint file.” It is a PowerPoint file whose important words and layout elements can be changed without rebuilding the whole slide.
Questions
- Is this different from inserting a screenshot into PowerPoint?
- Yes. An inserted screenshot is one picture. This reconstruction returned twelve separate slide objects, including editable text and layout regions, over a rebuilt background.
- Does the chart become an editable PowerPoint data chart?
- Not necessarily. The chart region can be separated from the rest of the slide, but a complex chart may remain an image rather than recover its original data series. Check the exported PPTX before relying on it.
- Will PowerPoint use the exact original font?
- The converter measures size, weight, colour and alignment from the screenshot, then uses a close available typeface. A screenshot does not contain the original font file, so an exact match is not guaranteed.